Power BI Advanced Visuals: Creating Moving Average and Percentile Charts

Power BI Advanced Visuals: Creating Moving Average and Percentile Charts

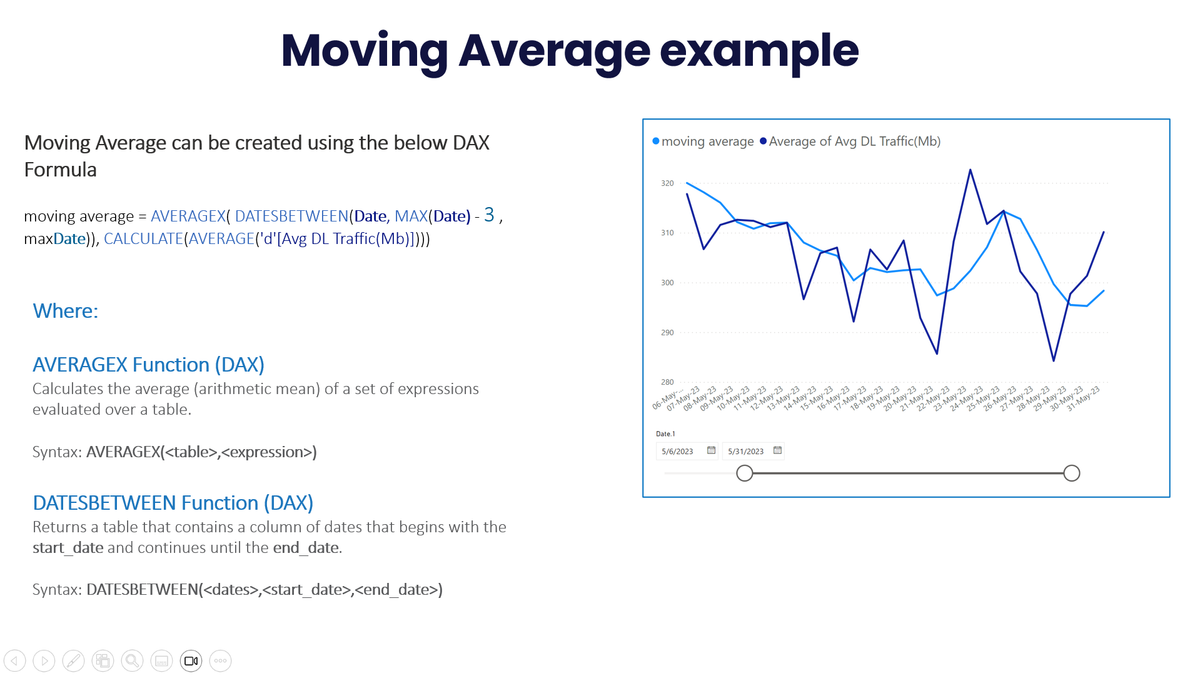
Moving Average Formula:
AVERAGEX(DATESBETWEEN([Date] , MAX([Date]) - 4 , MAX([Date])), CALCULATE(AVERAGE([KPI])))

Example for 90perc:
PERCENTILE.INC(metric, 0.9)

Read more

5G HARQ Explained: Soft Combining, HARQ Processes, ACK/NACK Timing, Codebook Types, Spatial Bundling, and 4G vs 5G Differences (Article)

5G HARQ Explained: Soft Combining, HARQ Processes, ACK/NACK Timing, Codebook Types, Spatial Bundling, and 4G vs 5G Differences (Article)

Introduction * HARQ is one of the most important reliability mechanisms in the 5G MAC layer. It directly affects retransmission speed, uplink control overhead, latency, and overall scheduling efficiency. * In simple words, HARQ gives 5G a fast retransmission loop. It helps recover transmission errors much faster than higher-layer recovery, which is

By Mohamed ELAdawi