materials
Session 7: 5G NSA Planning (Neighbors+ PCI) - Materials
Session 7 5G NSA Planning (Neighbors+ PCI)Session 7 5G NSA Planning (Neighbors+ PCI).pdf670 KBdownload-circle
I have 14 Years of RF Mobily communication experience in 4G/5G Design, Planning, and Optimization. I have gained international experience by working in 6 Countries with 9 Mobile Operators.

materials
Session 7 5G NSA Planning (Neighbors+ PCI)Session 7 5G NSA Planning (Neighbors+ PCI).pdf670 KBdownload-circle

youtube
Hello everyone! Welcome to the new training series. We will explore MIMO and dive deep into 5G Massive MIMO. I promise that after this training, you will learn important concepts and nuances that will help you understand the details of wireless communication. This knowledge will be valuable in your daily
materials
Welcome to our new training series. We will explore MIMO and dive deep into 5G Massive MIMO. I promise that after this training, you will learn important concepts and nuances that will help you understand the details of wireless communication. This knowledge will be valuable in your daily work. Content:
youtube
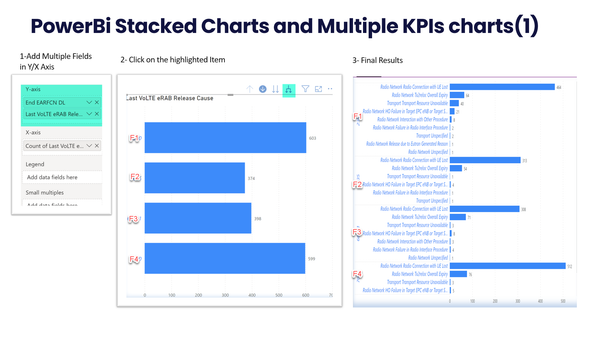
Learn how to create advanced Stacked and Histogram Charts using Power-BI.
youtube
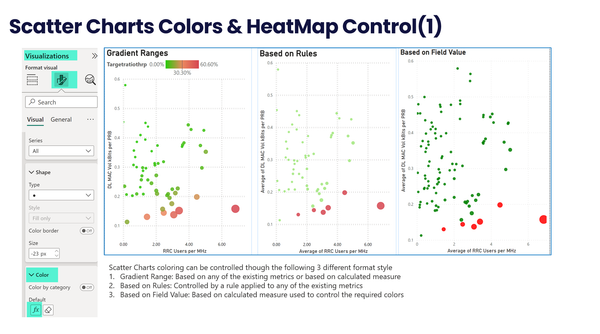
Learn how to create advanced Scattered Charts using Power BI .
materials
Part 1 Learn 5G RAN Features Part 1Learn 5G RAN Features Part 1.pdf759 KBdownload-circle Part 3: (UL Throughput Features) 5GRAN Features - Part 3 (UL Throughput)5GRAN Features - Part 3 (UL Throughput).pdf1 MBdownload-circle

youtube
This is the final session of the VoLTE E2E 𝗙𝗿𝗲𝗲 𝗧𝗿𝗮𝗶𝗻𝗶𝗻𝗴 on my YouTube Channel. The 4-hour training covers extensive content(Highlighted below), which took over a month to prepare. I believe this material is highly valuable and difficult not easy to find in other free or even paid sources. While
youtube
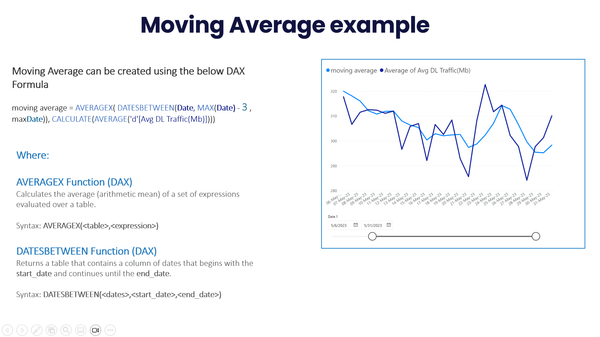
Moving Average Formula: AVERAGEX(DATESBETWEEN([Date] , MAX([Date]) - 4 , MAX([Date])), CALCULATE(AVERAGE([KPI]))) Example for 90perc: PERCENTILE.INC(metric, 0.9)
youtube
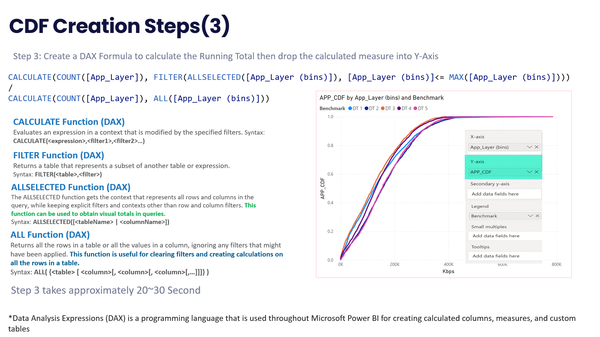
Learn how to create and customize a Cumulative Distribution Function (CDF) chart using Power BI DAX. DAX CDF Formula: CDF Formula: CALCULATE(COUNT([KPI]), FILTER(ALLSELECTED([BINS]), [(BINS)]<= MAX([(BINS)]))) / CALCULATE(COUNT([KPI]), ALL(BINS])) CDF Creation Steps Step 1: Create a Line/Scatter Chart Step 2: Drag the

youtube
This video explains all what you need to know about 4G TDD Subframe configuration types

youtube
This video covers the following important aspects of SSB: * The main differences between 4G and 5G PBCH and synchronization signal * The differences between channel raster and synchronization raster * Identification of SSB frequency locations and methods for calculation Materials are available at the link below. https://www.mohamedeladawi.com/nr-ssb-
materials
This video covers the following important aspects of SSB: - The main differences between 4G and 5G PBCH and synchronization signals - The differences between channel raster and synchronization raster - Identification of SSB frequency locations and methods for calculation YouTube Video: Video Materials: 5G Planning Inputs5G Planning Inputs.xlsx4 MBdownload-circle5G NSA
 Mohamed ELAdawi
Telecom Expert | 5G & 6G Trainer